Global Warming Prevention
GHG Emissions (Scope 1, 2) and Initiatives of the Kuraray Group
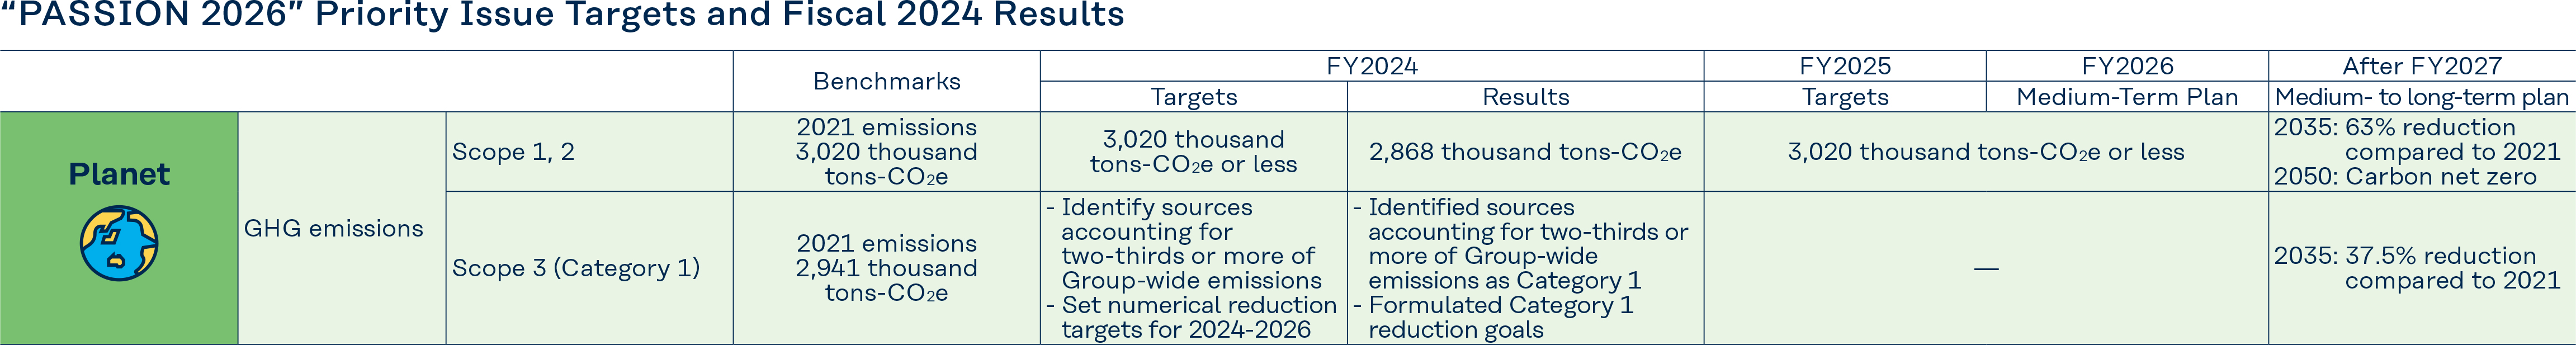
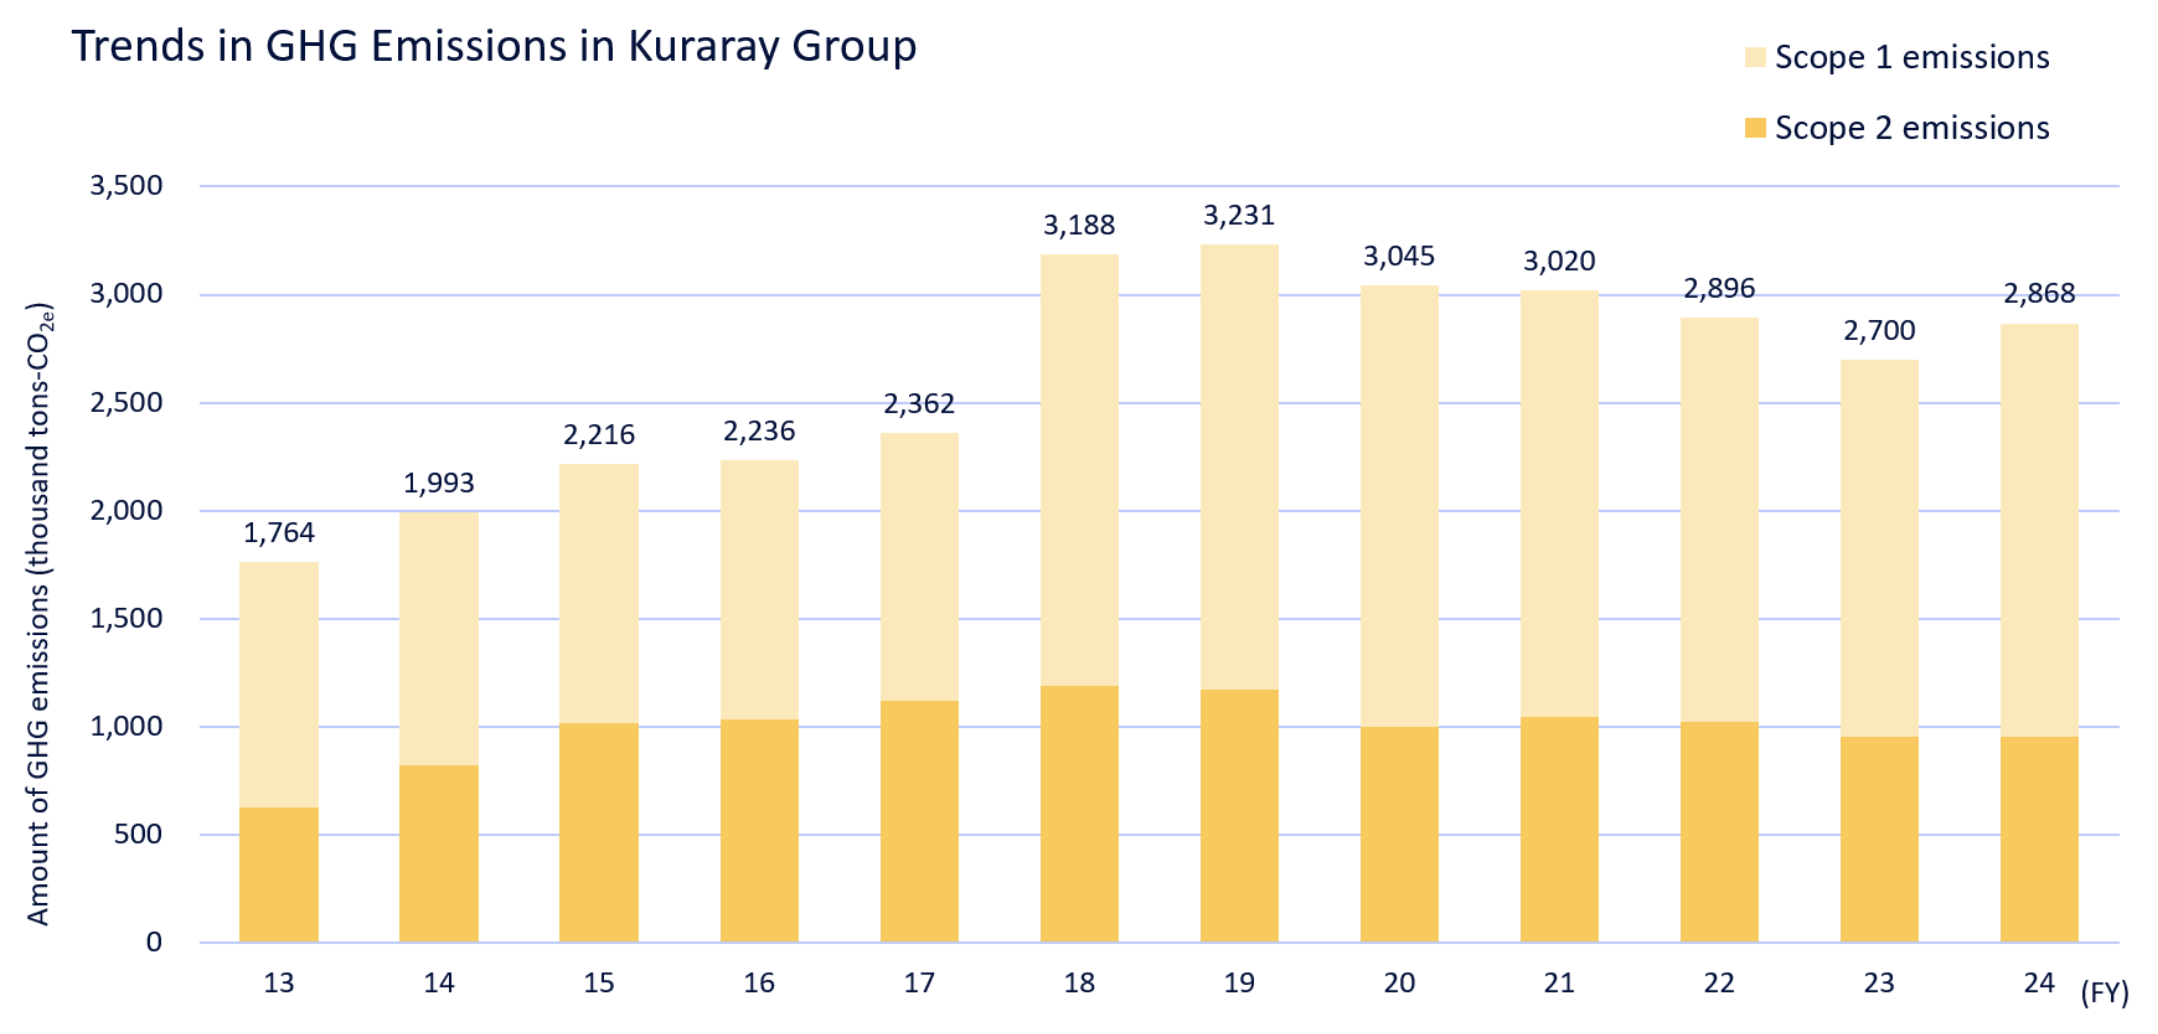
Total GHG emissions (Scope 1, 2) of the Kuraray Group increased by 6.2% from 2,700 thousand tons - CO2e in 2023 to 2,868 thousand tons - CO2e in 2024. (decreased by 5.0% compared to the results in 2021)
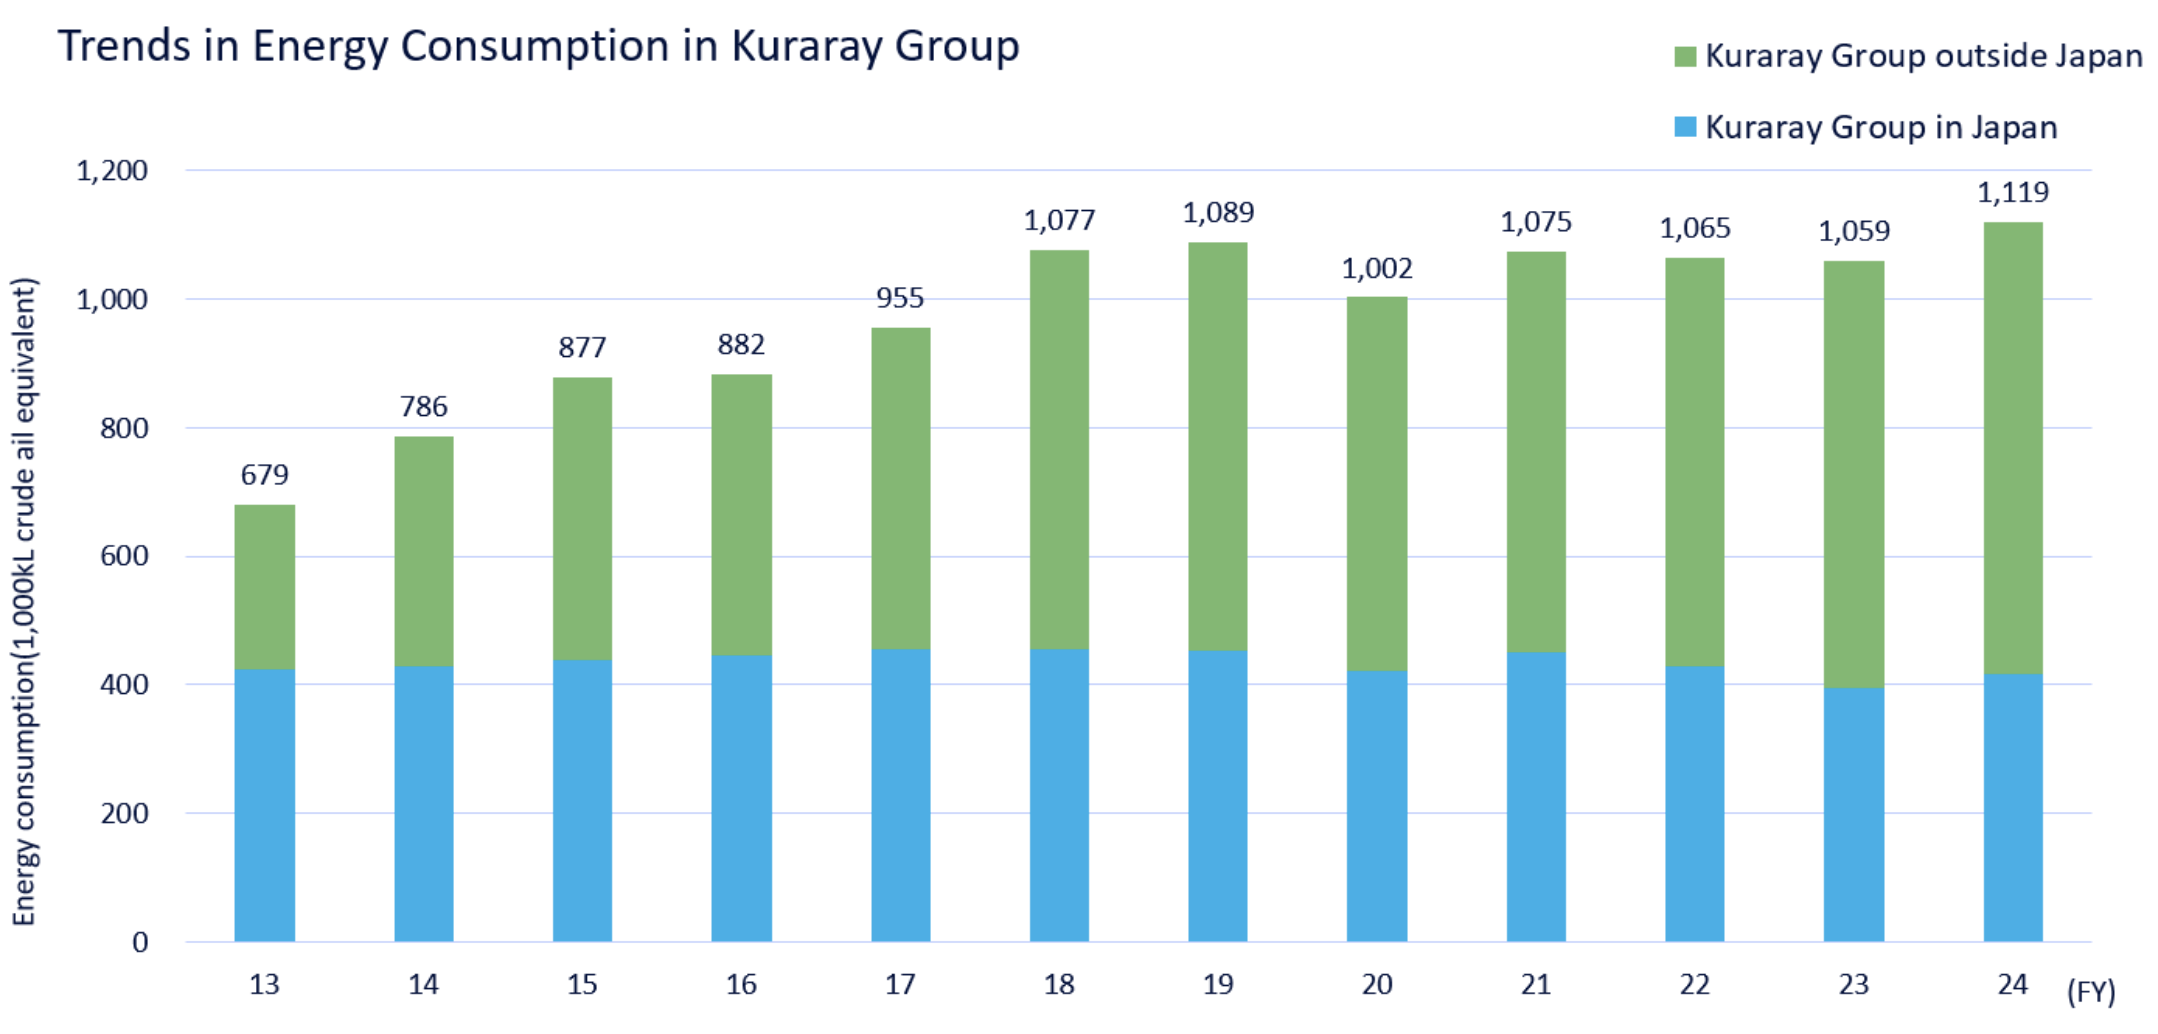
GHG emissions of the Kuraray Group in Japan increased from 1,144 thousand tons - CO2e in 2023 to 1,187 thousand tons - CO2e in 2024. This increase was due to higher production in some businesses compared to the previous year, which led to an increase in emissions from fuel and utilities. However, each Kuraray Group production site in Japan continued to work on GHG reduction measures, such as improving product yield, recycling raw materials and utilities, upgrading to energy-saving equipment, and carrying out energy-saving activities (waste elimination activities). In 2024, we implemented measures to reduce 17 thousand tons - CO2e minimizing the increase in emissions.
GHG emissions of the Kuraray Group outside Japan increased from 1,555 thousand tons - CO2e in 2023 to 1,681 thousand tons - CO2e in 2024. (In 2024, the Kuraray Group obtained unbundled energy attribute certificates and procured utilities through the rate plan for renewable energy sources equivalent to 117 thousand tons - CO2e, which are included in this GHG emission reductions.) The Kuraray Group outside Japan is also continuing to work on energy saving and product yield improvement that leads to GHG emission reductions at each production site. However, due to the launch of new production lines at Pearl River Plant of Calgon Carbon Corporation and the new plant in Poland of MonoSol LLC, as well as the full-scale operation of new production site for isoprene-related products at Thailand plant, leading to increased production and energy consumption, resulting in higher GHG emissions.
The sales intensity of energy consumption in the Kuraray Group, which was set as the target in the Sustainability Medium-Term Plan for Planet, reduced by 13.8% (improvement) in 2024 compared to 2019, far exceeding our target of the "Reduction (improvement) of 5% or more in 2026". Going forward, we will continue to work on further improvement of sales intensity through energy-saving activities that will contribute to the reduction of GHG emissions.
The Kuraray Group’s total GHG emissions increased in the period from 2014 to 2019 due to the incorporation of businesses through M&A, such as the acquisition of the vinyl acetate business and the activated carbon business (Calgon Carbon Corporation). In particular, the acquisition of Calgon Carbon Corporation in 2018 resulted in a significant rise in the Kuraray Group’s GHG emissions. The GHGs emitted by Calgon Carbon Corporation consist largely of the CO2 generated as a byproduct in the process of producing activated carbon products. Activated carbon is produced by burning a part of coal used in the process to form micropores on its surface. At this stage of the process, the carbon removed from the surface of the coal to form micropores is released into the atmosphere as CO2. In this way, activated carbon emits a large amount of CO2 during production. On the other hand, activated carbon is widely used around the world as an indispensable product for the adsorption and removal of hazardous chemical substances contained in factory waste gas and for the purification of industrial effluents and raw water for drinking. Activated carbon thus contributes greatly to improving the global environment and reducing environmental impact. The Kuraray Group plans to execute CAPEX of 80 billion Japanese yen by 2030, and will continue to consider establishing the technologies to implement Carbon dioxide Capture, Utilization and Storage (CCUS) system applicable to by-product CO2 in the production process. We will also continue to invest in energy-saving , fuel conversion, and the transition to renewable energy for electricity. Furthermore, we are exploring the procurement of emission-free clean energy sources such as green hydrogen and green ammonia around 2035. We aim to achieve a 63% reduction in GHG emissions compared to 2021 levels by 2035, and Carbon Net Zero by 2050.
<GHG emissions (Scope 1, 2), Energy consumption (Entire Kuraray Group)>
| 2019 | 2020 | 2021 | 2022 | 2023 | 2024 | |||
|---|---|---|---|---|---|---|---|---|
| Kuraray Group(in Japan+outside Japan) | GHG emissions (Scope 1, 2) | thousand tons-CO2e | 3,231 | 3,045 | 3,020 | 2,896 | 2,700 | 2,868 |
| Scope 1 emissions | thousand tons-CO2e | 2,060 | 2,045 | 1,973 | 1,877 | 1,748 | 1,917 | |
| Scope 2 emissions | thousand tons-CO2e | 1,170 | 1,000 | 1,047 | 1,020 | 952 | 951 | |
| Energy consumption | crude oil equivalent,1,000 kl | 1,089 | 1,002 | 1,075 | 1,065 | 1,059 | 1,119 | |
| Sales intensity of energy consumption (intensity of 2019 as 100) | target | Reduction of 5% or more in 2026 compared to 2019 | ||||||
| result | 100 | ー | ー | ー | ー | 86.6 (13.8% reduction) |
||
【Notes】As a result of the change in months in each fiscal year, the environmental data and information contained in this report including graphs are as follows.
- ・Before fiscal 2013: Actuals in 12 months from April to March of the following year
- ・Fiscal 2014: Actuals for 9 months from April to December + Actuals for January to March 2014 (or estimated value) [Partially overlaps with fiscal 2013]
- ・After fiscal 2015 : Actuals for 12 months from January to December
<GHG emissions・Energy consumption(Separate in Japan and outside Japan)>
| 2019 | 2020 | 2021 | 2022 | 2023 | 2024 | |||
|---|---|---|---|---|---|---|---|---|
| Kuraray Group in Japan | GHG emissions (Scope 1, 2) | thousand tons-CO2e | 1,310 | 1,229 | 1,340 | 1,236 | 1,144 | 1,187 |
| Scope 1 emissions | thousand tons-CO2e | 1,121 | 1,067 | 1,163 | 1,047 | 970 | 1,021 | |
| Scope 2 emissions | thousand tons-CO2e | 189 | 162 | 177 | 189 | 174 | 166 | |
| Energy consumption | crude oil equivalent, 1,000 kl | 452 | 422 | 452 | 430 | 394 | 416 | |
| Kuraray Group outside Japan | GHG emissions (Scope 1, 2) | thousand tons-CO2e | 1,921 | 1,816 | 1,680 | 1,660 | 1,555 | 1,681 |
| Scope 1 emissions | thousand tons-CO2e | 939 | 978 | 810 | 830 | 778 | 896 | |
| Scope 2 emissions | thousand tons-CO2e | 981 | 838 | 870 | 830 | 777 | 785 | |
| Energy consumption | crude oil equivalent, 1,000 kl | 637 | 580 | 623 | 635 | 665 | 703 | |
GHG Emissions(Scope 3)
The GHG Protocol* classifies GHG emissions into three categories: Scopes 1, 2 and 3.
- Scope 1: Direct emissions
- GHG emissions generated by fuel combustion at the plants and other facilities of one’s own company
- Scope 2: Indirect emissions
- GHG emissions generated by the use of purchased energy such as electricity, heat, and steam supplied by other companies
- Scope 3: Other indirect emissions
- The other indirect emissions. GHG emissions along the entire supply chain (from procurement of raw materials to product disposal.)
Mandated under the law by which businesses calculate and report Scope 1 and Scope 2 to the government, we report these figures for the whole Kuraray Group to the government and publish the results mainly in the Kuraray Report and on the Kuraray Group’s website.
On the other hand, Scope 3, which means the GHG emissions based on the entire supply chain related to us other than Scope 1 and Scope 2, is indirect GHG emissions generated from the viewpoint of a life cycle such as raw material procurement, product distribution, product use and disposal as well as the direct emissions related to our business activities. In 2024, we have changed the calculation method for Scope 3 (Category 1) and expanded the scope of calculation to the entire Kuraray Group including overseas. Furthermore, we have greatly increased the number of raw materials, instead of major raw material only. This new calculation method, which uses emission factor applied for individual raw material (i.e., weight basis), has greatly improved the accuracy of our calculations, compared to the previous method by multiplying (i) purchase price and (ii) emission factor per amount which is defined by “industry category” (i.e., purchase price basis).
Furthermore, we have set a new goal for Category 1, which had the largest GHG emissions within Scope 3, aiming to reduce emissions by 37.5% by 2035 compared to 2021 levels. The Kuraray Group's Scope 3 (Category 1) emissions increased by 20.4%, from 2,544 thousand tons - CO2e in 2023 to 3,062 thousand tons - CO2e in 2024 (increased by 4.1% compared to 2021). This increase in GHG emissions was due to higher production in some businesses, which led to an increase in raw material purchases, as well as changes in GHG emission factors compared to the previous year. We will continue to collaborate with our suppliers to reduce GHG emissions.
* GHG Protocol (Greenhouse Gas Protocol) is an initiative to develop international standards and related tools on greenhouse gases and climate change led by the World Resources Institute (WRI) and World Business Council for Sustainable Development (WBCSD) and participated in by corporations, NGOs, government institutions and other organizations throughout the world.
Conceptual Image of GHG Emission throughout the Kuraray Group Supply Chain in 2024
( (1) to (15) show categories of Scope 3)

<GHG emissions(Scope 3)*1>
(Unit: thousand tons-CO2e)
| Category | FY2021 | FY2022 | FY2023 | FY2024 |
|---|---|---|---|---|
| 1.Purchased goods and services*2 | 2,941 | 2,872 | 2,544 | 3,062 |
| 2.Capital goods | 133 | 157 | 344 | 263 |
| 3.Fuel and energy related activities excluding Scope 1 and 2 | 546 | 549 | 534 | 574 |
| 4.Transportation and distribution (upstream) | 264 | 284 | 250 | 277 |
| 5.Waste generated in operations | 78 | 78 | 58 | 68 |
| 6.Business travel | 1 | 2 | 2 | 2 |
| 7.Employee commuting | 4 | 4 | 5 | 5 |
| 8.Leased assets (upstream) | Emissions from offices, electrical appliances, and company cars are included in Scope 1 and 2. | |||
| 9.Transportation and distribution (downstream) | Kuraray Group's products are mainly sold as intermediate materials for various applications, making it difficult to track and account for emissions from transportation, processing, and end-of-life treatment of sold products. Therefore, it is not feasible to reasonably calculate emissions for these categories, and they are excluded from the calculation. | |||
| 10.Processing of sold products | ||||
| 11.Use of sold products | ||||
| 12.End-of-life treatment of sold products | ||||
| 13.Leased assets (downstream) | Not applicable because of no leased assets to other company. | |||
| 14.Franchises | Not applicable as the company does not operate franchise system. | |||
| 15.Investments | Other company's stock was not held for investment purpose as reported in the Securities Report. | |||
| Total Scope 3 | 3,967 | 3,946 | 3,737 | 4,251 |
- *1 Boundary is the Kuraray Group's consolidation basis. (Coverage:100%)
- *2 GHG emissions were calculated by multiplying (i) weight of goods and services purchased from suppliers accounting for the top 90% of the Kuraray Group's total purchasing amount and (ii) emission factor applied for each of goods and services. Thereafter, emissions equivalent to the total amount of goods and services purchased by the Kuraray Group were calculated.
Emission factors for weight were sourced from the "Managed LCA Content (GaBi) (Sphera)." For a very small portion of purchases where it is not feasible to calculate by emission factor per weight, were sourced from the Ministry of the Environment's "Emission Factor Database for Calculating GHG Emissions through the Supply Chain" that provides emission factor per amount.
<Example of Scope 3 GHG Emission Reduction Efforts (Reduction of Environmental Load during Product Transportation)>
We are working to reduce GHG emissions at the logistics stage, when transporting products to users. For example, to improve the efficiency of transportation by truck, we are consolidating the storage locations of products (warehouses) to ship products previously shipped from multiple locations from a single location. Through such large-lot transportation hubs, we are working so that products previously transported using multiple trucks can be loaded onto a single trailer. We also continue to pursue a modal shift, switching from trucks and other motor vehicles to modes of transportation with less environmental impact, such as freight trains and ships. In addition, in 2019 we submitted a declaration of voluntary activities in support of the White Logistics Movement being promoted by the Japanese government.
Carbon Footprint of Products (CFP) Utilization
There is also a growing trend to calculate CO2 emissions across the entire supply chain for final products. In this context, customers are more frequently requested for the carbon footprint of Kuraray Group products. We established and started operating a globally unified CFP*1 calculation system in 2024. Our carbon footprint calculation method makes reference to major international standards*2 and guidelines for the chemical industry*3. The calculation range is defined as up to the factory gate (Cradle-to-gate). Additionally, in our system, the organization making calculations and the organization doing verification are separate divisions to ensure objectivity and reliability. We also use carbon footprint calculation value in the development of new environmentally friendly products that utilize recycled materials and biomass resources.
- *1 The carbon footprint of products indicates greenhouse gas emissions emitted throughout the entire life-cycle of products or services, from raw material procurement to disposal and recycling, converted into CO2. In the materials industry, it is common to define the calculation range as cradle-to-gate.
- *2 ISO14040:2006,ISO14044:2006,ISO14067:2018
- *3 Japan Chemical Industry Association/ Guidelines for Calculating the Carbon Footprint of Products in the Chemical Industry (Published February 2023), Together for Sustainability The Product Carbon Footprint Guideline for the Chemical Industry (Version 2.1)
