History in Graphs
The graph below shows the Kuraray Group’s net sales and operating income since 1991.
The graph below that shows the composition of net sales in the same period.
The Kuraray Group has steadily expanded its business while drastically changing its business structure, as these two graphs indicate.
While improving the efficiency of fiber and textile operations, which faced a tough business environment, we have expanded the chemicals business, which leverages the Group’s proprietary technologies.
As a result, the sales ratio of fibers and textiles has decreased from about 60% in 1991 to about 30% in 2006, while sales of chemicals grew from about 40% to about 70% of total sales, strengthening our business portfolio. Then in October 2007, the industry category of our shares was changed from “Fibers and Textiles” to “Chemicals,” signifying our start as a specialty chemical provider both in name and reality.
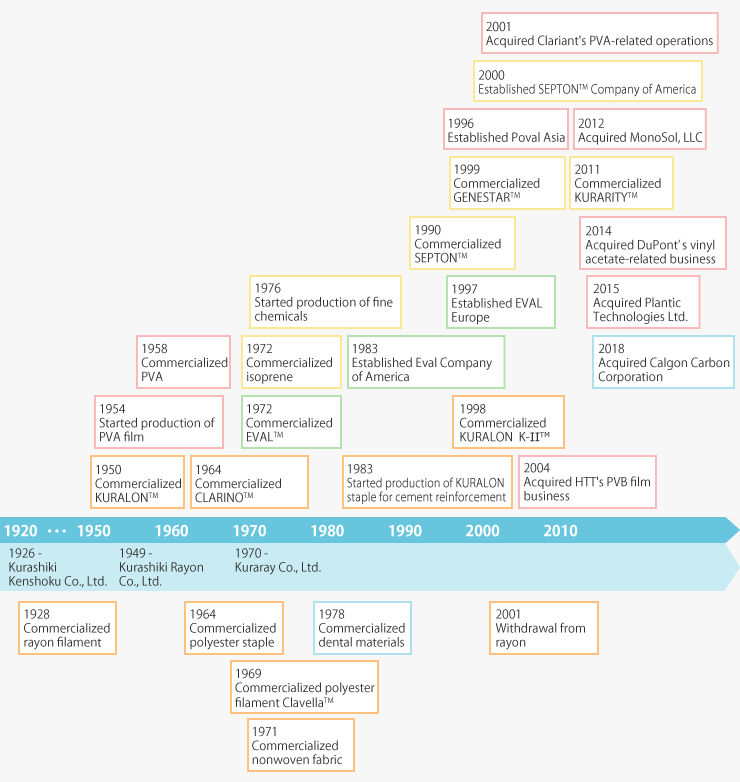
We have a history of applying our technical strengths to create products that the world had never seen before. In 1950, we were first in the world to commercialize KURALON™ (PVA fiber). It was the first synthetic fiber invented in Japan. Since then, we have created a number of original products, including PVA resin, which is a raw material of KURALON™; optical-use PVA film, which is essential for LCDs; EVAL™, which features excellent gas barrier properties; a lineup of chemical products made from the world’s only synthetic isoprene monomers; and GENESTAR™ (commercialized in 1999), a highly heat-resistant polyamide resin. In 2011, we commercialized KURARITY™, an acrylic thermoplastic elastomer.
Net Sales and Operating Income Trends

Net Sales Composition
Note: The figures in the graphs for FY2014 have been adjusted to reflect the 12 months from January to December for the Company and its consolidated domestic and overseas subsidiaries